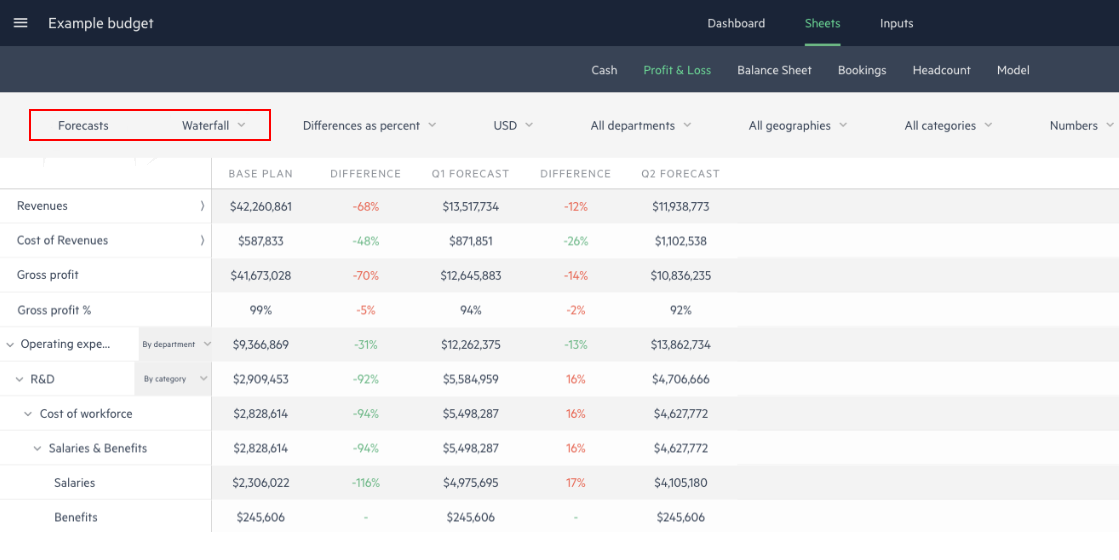
Waterfall view
Waterfall view compares the base budget and forecasts, and is available in all types of reports.
Waterfall charts track the actual results (if added) compared to both your base budget and your saved forecasts.
To view a waterfall chart:
-
Create a base budget and at least one forecast version. For more information, see Navigate version history.
-
From the Sheets tab, set the first dropdown list to Forecasts and the second to Waterfall.
-
Toggle whether you want to see the difference in numbers or as a percentage.
Is this helpful?
In this topic

